Disaster Cycle Services · Volunteer Connection
Disaster Responder Intent
The national baseline across all six divisions, and a Labor Day target that can actually be hit. Prepared for Scott O'Connell.
The Plan
01Do not promise a percentage of 32,396›
The roster is now complete. All six divisions are in hand, so the denominator is no longer a moving number and the starting line is not a guess. Of 32,396 disaster responders, 1,185 have any deployment intent on file and 1,138 have it on their primary GAP.
The failure mode for this campaign is arithmetic, not effort. Every target circulating — 100%, 70%, 50% — is quoted against the full roster, and the full roster includes 15,918 people who have never been assigned to a disaster relief operation and who record intent at a rate of 1.6%. Asking them in 24 days is not a campaign, it is a rounding error with a deadline.
Intent already concentrates in one place: recent deployment. Among the 2,100 people deployed in the last 30 days, 15.3% already have intent recorded — roughly ten times the never-deployed rate. That group did not receive a better email. They are simply the people for whom the question is currently live.
The recommendation is to change the denominator, not the ambition. Publish the target against the last-12-month deployed list of 7,536. Hitting 52% of that list produces 3,887 records, which is 12% of the full roster — a number that survives contact with a briefing and can be defended line by line.
02All six divisions, one honest number›
Every figure comes from a single export type — the Volunteer Connection NHQ Disaster Responder Roster — which carries the full responder universe and the intent columns on the same row. Numerator and denominator arrive in one file, so no join is required and no pivot has to be reconciled by hand.
| Division | Responders | Regions | Any Intent | % Intent | Primary GAP Intent | Deployed ≤12mo |
|---|---|---|---|---|---|---|
| Pacific | 6,504 | 9 | 217 | 3.3% | 210 | 1,712 |
| SWARM | 6,411 | 9 | 224 | 3.5% | 209 | 1,311 |
| SECAR | 6,254 | 8 | 185 | 3.0% | 176 | 1,416 |
| Northeast | 5,848 | 9 | 311 | 5.3% | 304 | 901 |
| North Central | 3,930 | 6 | 149 | 3.8% | 143 | 1,434 |
| Central Atlantic | 3,449 | 6 | 99 | 2.9% | 96 | 762 |
| National | 32,396 | 47 | 1,185 | 3.7% | 1,138 | 7,536 |
Intent means any of GAP1–GAP3 Intent populated. Primary GAP intent means GAP1 Intent specifically, which is what the campaign actually asks for.
The spread is narrow, and that is the finding
Divisions run from 2.9% to 5.3%. Northeast leads, but leads at five percent — no division has solved this, so there is no internal model to copy and no region to point at as proof the target is reachable. Whatever gets promised has to be built, not borrowed.
Verified against double counting, three ways
- One export per division. Six files, six distinct divisions. A Pacific PDF delivered the same day was deliberately not loaded — Pacific was already covered by its spreadsheet export.
- 32,396 unique member numbers against 32,396 rows. Member Num is unique across the whole national set.
- Zero duplicates dropped by the loader. The deduplication step ran and found nothing to remove.
03Intent follows deployment. Nothing else comes close›
This is the most useful cut in the data and it holds across all six divisions. Sequence the campaign this way and the early numbers move fastest; ignore it and the campaign spends its 24 days on the population least likely to answer.
| Group | People | With Intent | % Intent | What It Is |
|---|---|---|---|---|
| Deployed 0–30 days | 2,100 | 322 | 15.3% | Warmest list. Week one. |
| Deployed 31–365 days | 5,436 | 432 | 7.9% | Week two. Completes the target list. |
| Available now (Avail = Yes) | 2,722 | 405 | 14.9% | Willing but unrecorded. A data gap. |
| No primary GAP at all | 2,291 | 17 | 0.7% | Nothing to confirm. Needs a different flow. |
| Never deployed | 15,918 | 247 | 1.6% | Half the roster. Not this campaign. |
The 2,722 Who Say They Are Available
Only 14.9% of them have intent recorded. They have already told Volunteer Connection they are available right now and still have no intent on file. That is a records gap, not a willingness gap, and it is the cheapest conversion in the whole dataset.
The 2,291 With No Primary GAP
They have nothing to confirm, so the campaign's core ask is meaningless to them and their 0.7% rate reflects that. Assign a GAP first, then ask — and keep them out of the denominator until you do.
04Target 12% of the roster. Say it as 52% of the deployed›
Both numbers describe the same 3,887 records. The first is what leadership will ask for; the second is what the campaign will actually work. Publishing both, together, is what keeps the target honest when someone asks why it is not 50%.
Floor — 8%
Records total, +1,406 from today. 59 a day nationally. This is the number if the campaign is messy, launches slowly, or relies on email alone.
Target — 12%
Records total, +2,702 from today. 113 a day nationally, about 2.4 per region per day, and 52% of the last-12-month deployed list. This is the recommended commitment.
Stretch — 16%
Records total, +3,998 from today. 167 a day. Reachable only if text messaging and named GAP supervisors both actually fire.
Why 2.4 records per region per day is a real plan
There are 47 regions. The target asks each of them for between two and three new intent records a day for 24 days, drawn from a warm list averaging 160 people per region. A GAP supervisor working a 20-name call list converts that in an afternoon. The same target quoted against the full roster asks for 21 records per region per day from a list of 689, most of whom have never deployed.
What the alternatives actually cost
| Roster Target | Records Needed | New In 24 Days | Per Day | Verdict |
|---|---|---|---|---|
| 100% | 32,396 | 31,211 | 1,300 | Not arithmetically possible. |
| 70% | 22,677 | 21,492 | 896 | Not possible; invites gaming. |
| 50% | 16,198 | 15,013 | 626 | Twice the entire deployed list. |
| 12% | 3,887 | 2,702 | 113 | Recommended. Defensible line by line. |
05Six regions set the pace. Six need a named owner this week›
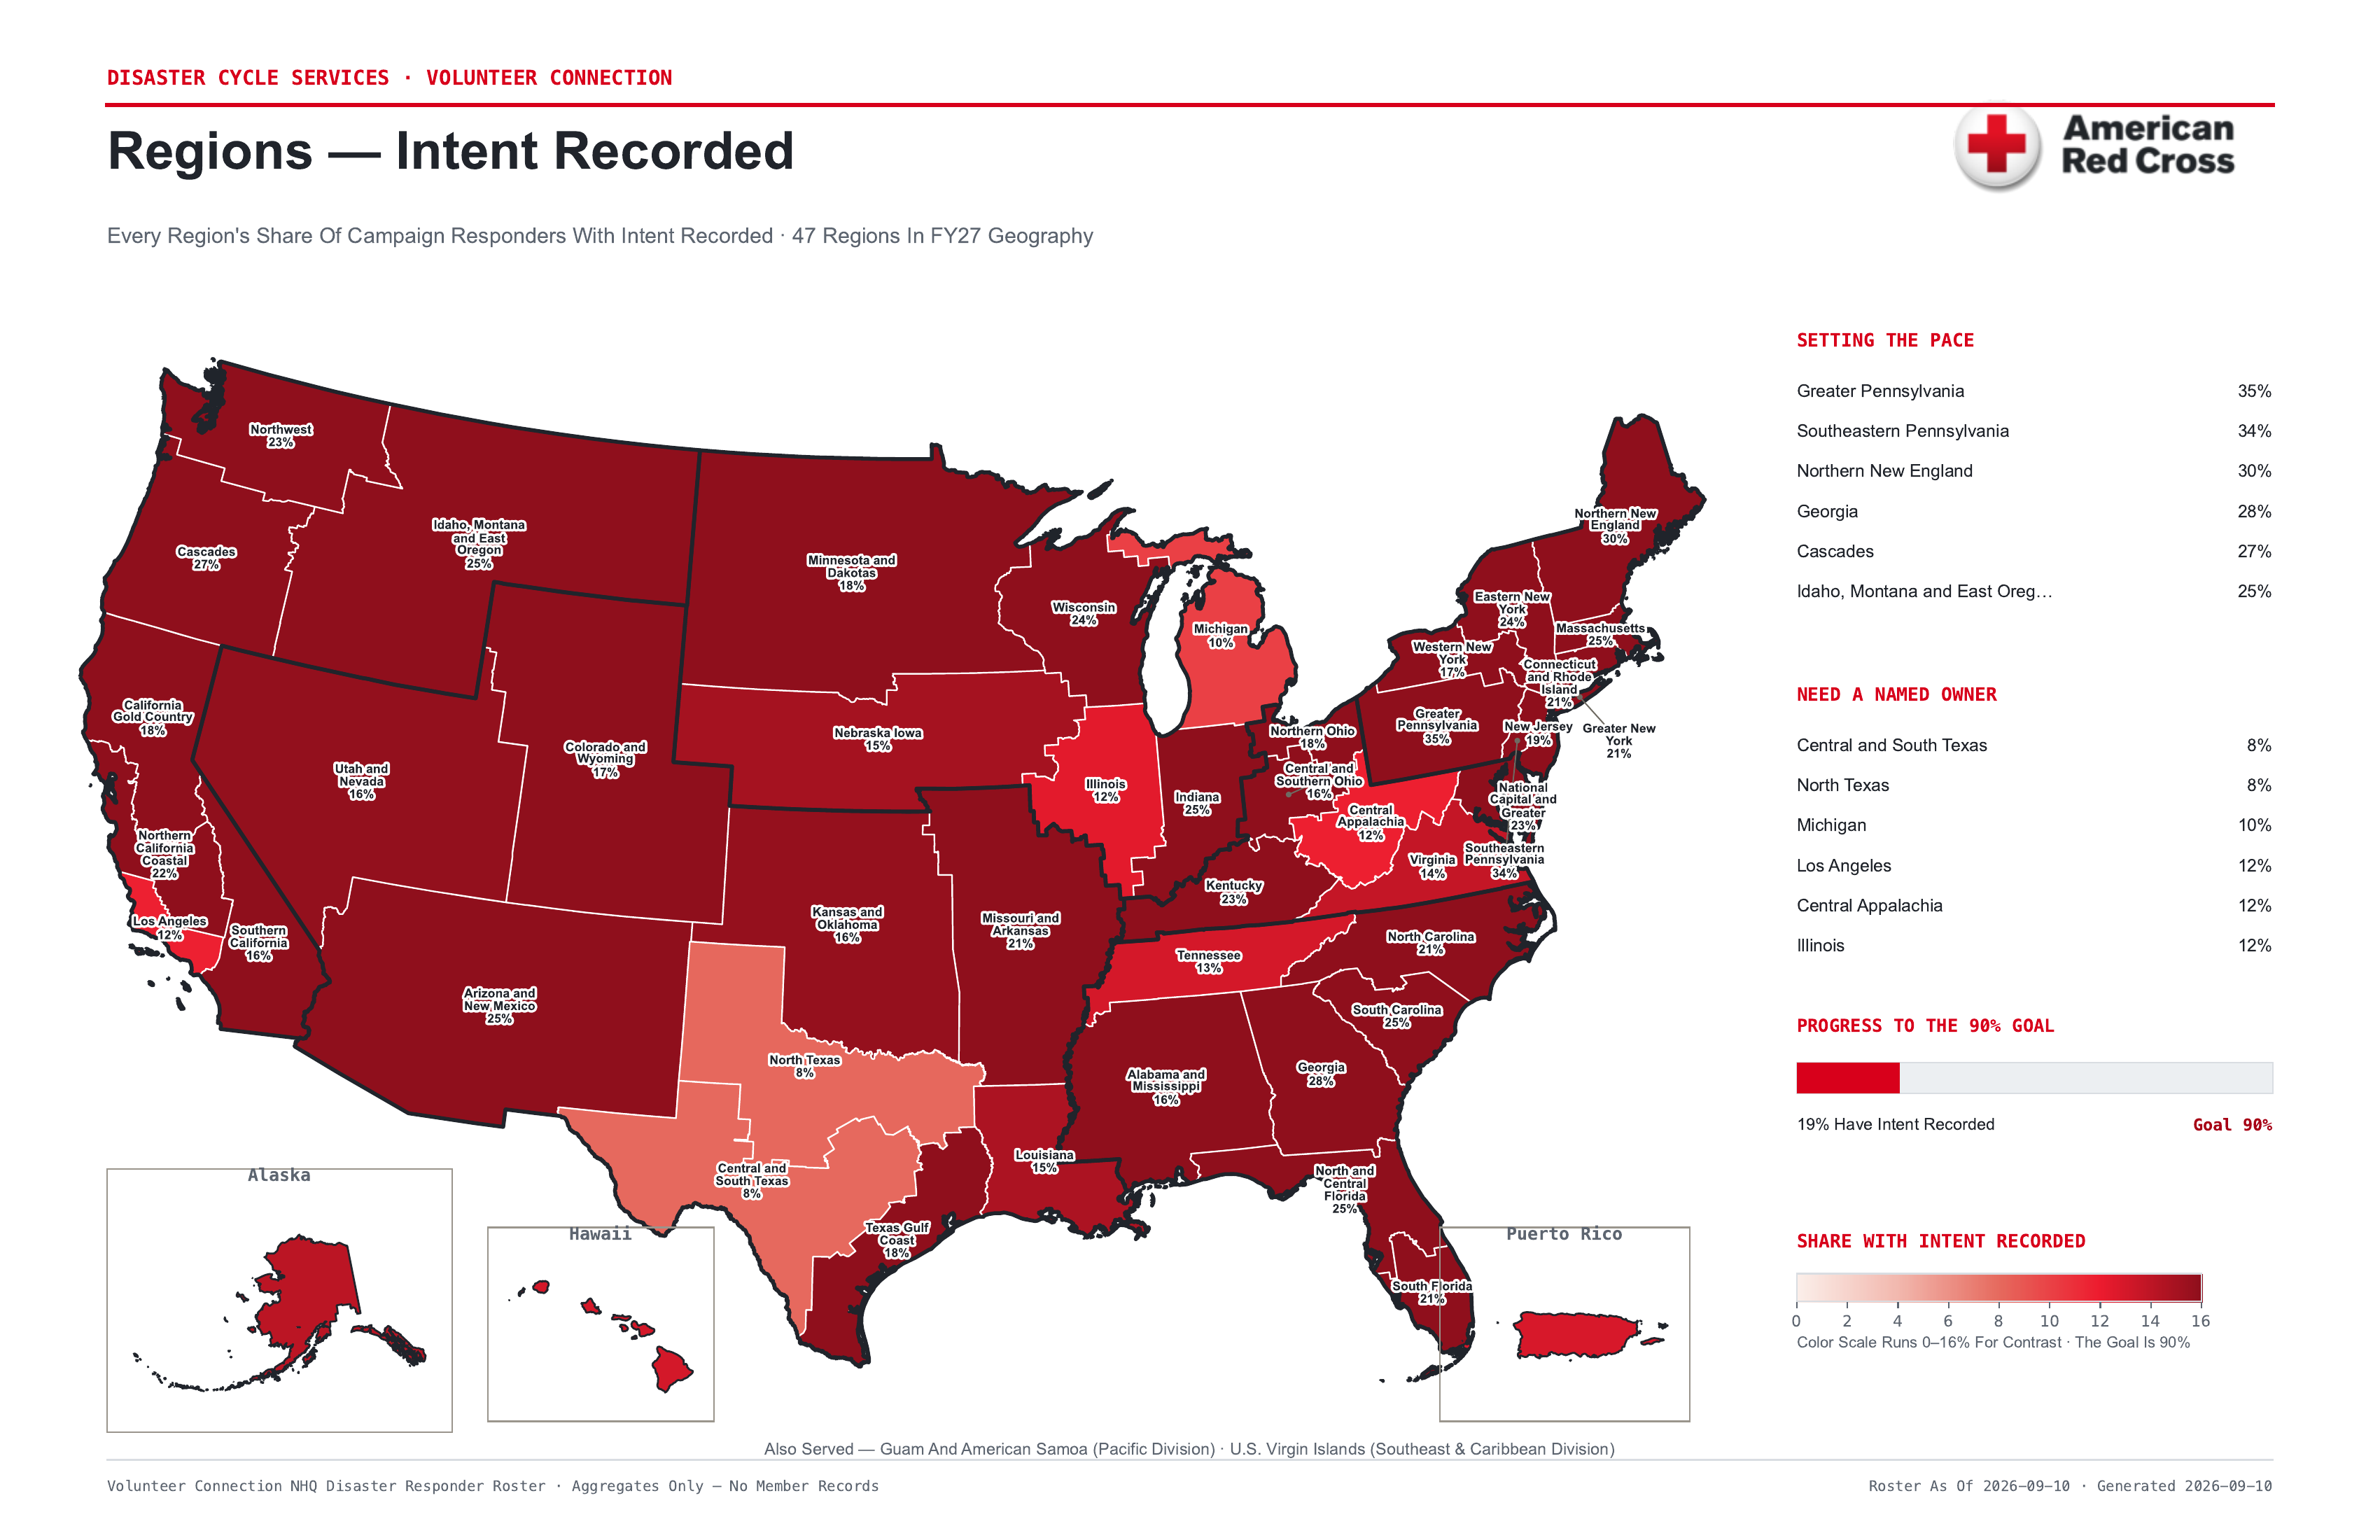
Ranked by share of the region's roster with intent recorded. The right-hand column is the one that matters operationally: the share of each region's recently deployed people who have intent, because that is the list the campaign will actually work. The progress map shows all 47.
Setting The Pace
| Region | Division | Roster | Intent | % Roster | Deployed ≤12mo | % Of Those |
|---|---|---|---|---|---|---|
| Northern New England | Northeast | 427 | 59 | 13.8% | 77 | 36.4% |
| Southeastern Pennsylvania | Northeast | 360 | 30 | 8.3% | 59 | 27.1% |
| Indiana | North Central | 605 | 48 | 7.9% | 178 | 18.5% |
| Arizona and New Mexico | SWARM | 806 | 62 | 7.7% | 147 | 23.1% |
| Cascades | Pacific | 627 | 37 | 5.9% | 141 | 22.0% |
| Massachusetts | Northeast | 578 | 34 | 5.9% | 86 | 20.9% |
Need A Named Owner
| Region | Division | Roster | Intent | % Roster | Deployed ≤12mo | % Of Those |
|---|---|---|---|---|---|---|
| Puerto Rico | SECAR | 264 | 2 | 0.8% | 12 | 0.0% |
| Tennessee | SECAR | 902 | 7 | 0.8% | 195 | 1.5% |
| North Texas | SWARM | 710 | 7 | 1.0% | 135 | 2.2% |
| Los Angeles | Pacific | 1,116 | 16 | 1.4% | 266 | 3.8% |
| Pacific Islands | Pacific | 558 | 8 | 1.4% | 212 | 2.8% |
| Central and South Texas | SWARM | 719 | 11 | 1.5% | 163 | 4.3% |
Los Angeles Is The Single Biggest Opportunity
The largest region in the country by roster, with 266 people deployed in the last year and only 10 of them holding intent. It is one named owner away from contributing more records than most divisions' small regions combined.
Some Regions Need Cleanup, Not A Campaign
Alabama and Mississippi (226 with no primary GAP), Illinois (183), Central and Southern Ohio (177), and Wisconsin (171) carry the heaviest missing-GAP burden. Asking those people to confirm intent asks them to confirm nothing.
06Plays 1–7 — Fix the denominator, then work the warm list›
These twenty plays were first written against the Pacific Division alone. Every number has been recomputed against the complete national roster. Plays that rest on Pacific-only evidence are marked.
7,536 people, not 32,396. Every scoreboard, every regional target, every slide. This single change is what makes the rest of the plan arithmetically possible.
In the Pacific export, 99% have a cell number and 86% have opted in to text. The other five divisions do not carry those columns at all, so this is the strongest play in the plan and also the one that cannot yet be costed nationally. Request the columns this week.
They already sit at 15.3% intent, roughly ten times the never-deployed rate. Warmest list, fastest early numbers.
At 7.9% intent they are half as warm as week one but seven times warmer than the never-deployed. Together the two weeks cover the full 7,536-person target list.
Half the national roster, converting at 1.6%. Different message, different season. Ask them after Labor Day.
Only 14.9% have intent recorded. 1,321 of them also deployed in the last year, which makes them the highest-yield names on the entire list.
2.4 records per region per day is a phone call, not a mail merge. A division-wide email against 7,536 names converts worse than 47 supervisors each working twenty.
07Plays 8–14 — Make the ask short, and make it land three times›
Every click between the message and the field is a conversion lost, and this audience is being asked during a wildfire season, not at a desk.
Twenty-four days does not support a drip campaign. Three touches inside the first ten days leaves two weeks for the supervisor lists to do the real work.
Nothing else. Every additional field lowers completion.
Northern New England (13.8%) and Southeastern Pennsylvania (8.3%) set the pace. Puerto Rico, Tennessee, North Texas, Los Angeles, and Pacific Islands need a named owner before the scoreboard means anything.
2,291 people nationally have no primary GAP: SWARM 546, North Central 542, SECAR 493, Central Atlantic 355, Pacific 241, Northeast 114. Assign a GAP first, then ask.
Their intent rate is 0.7% because the campaign's core question does not apply to them. Only 204 deployed in the last year — small enough to run as a clean side workflow.
A message from a peer who just came off an operation carries weight that a division email does not.
08Plays 15–20 — Protect the channel, and publish the result either way›
The campaign closes the week after Labor Day, in the middle of wildfire and hurricane season. That is the reason a volunteer should care.
Not a spreadsheet of 32,396. Not a PDF of 7,536. A named list, a daily count, and a person who owns it.
An 86% opt-in rate is an asset that gets spent, not a channel that refills. Two messages against the warm list; do not burn it on the never-deployed half of the roster.
Resend the same ask to non-responders. New tactics late in a 24-day window add coordination cost without adding records.
This is also the anti-gaming control. Count records that a volunteer saved, report staff-entered records separately, and the 80–100% pressure has nowhere to hide.
3.7% to whatever it reaches, by region, on the last-12-month deployed list. Publish it whether it hits or misses. An honest 11% against a stated 12% target is more useful next year than 70% against a denominator nobody can reconstruct.
09Three gaps, and what to request this week›
1. Contactability, Outside Pacific
The Pacific export carries 59 columns including cell phone, text opt-in, and account ID. The other five carry 41 to 43 and drop all three. The text-message strategy is unevidenced for 25,892 of 32,396 responders. Ask: re-run the roster in the Pacific 59-column layout for all six divisions.
2. Whether Anyone Is Logging In
The Disaster Responder Roster carries intent but no login data. The Active Members Report carries login recency but no intent field. Neither carries both. Ask: both exports for the same division on the same day, so they can be joined on member number.
3. What Counts As A Volunteer-Completed Update
The export records that an intent value exists, not who entered it. That distinction is the entire anti-gaming control, and it cannot be measured from this file. Ask: confirm whether entry source is stored and can be exported. If it is not, say so in the campaign report.
Two smaller caveats worth carrying into the briefing
- Multi-region responders are counted once. Zero duplicates were found nationally, so this affects nothing today — but it is the rule, and it matters if rosters are ever re-cut.
- Roster freshness varies. 38% of responders have had their record confirmed within the last year, which means a majority of the contact information behind this campaign is more than twelve months old.
This week's checklist
- Request the 59-column roster layout for all six divisions
- Decide the target: 8% floor, 12% recommended, 16% stretch
- Publish the denominator as the 7,536 deployed in 12 months
- Name an owner for Los Angeles, Tennessee, and North Texas
- Split the 2,291 missing-GAP cleanup into its own sprint
- Confirm whether entry source can be exported
- Stand up the daily by-region record count before launch
- Agree that only a saved primary-GAP record counts
10Where every number came from›
Source. Volunteer Connection NHQ Disaster Responder Roster, one export per division, six of six divisions, runs 2026-08-13 and 2026-08-14. Combine. Concatenate, then deduplicate on Member Num — 32,396 unique values, 0 dropped. Derive. Recency measured against each division's own report-run date. Publish. Aggregate counts and percentages only — no name, email, address, or phone number leaves the private source directory.
Definitions used throughout
| Term | Definition |
|---|---|
| Any intent | Any of GAP1, GAP2, or GAP3 Intent populated. |
| Primary GAP intent | GAP1 Intent populated. This is what the campaign asks for. |
| Deployed ≤12 months | Last assigned date within 365 days of the report run. The recommended denominator: 7,536 people. |
| Available now | Avail = Yes on the roster. 2,722 people. |
| No primary GAP | Primary GAP field empty — nothing to confirm. 2,291 people. |
Reproducing this
Aggregate tables and the rebuild script live in the private
vc-responder-intent repository; the generator scripts live in
red-cross-data/tools/. Adding or replacing a division export is a
file drop plus bash refresh.sh. Source exports carry volunteer
names, addresses, emails, and cell numbers; they are gitignored and stay on
local disk.
Reports
- Brief — National Baseline And Labor Day Plan (PDF) The original 11-page briefing document for Scott O'Connell.
- All Divisions — Intent Baseline All six divisions combined: 32,396 responders, 47 regions.
- Pacific Division — Intent Baseline The original Pacific-only analysis, including the contactability columns.
- Engagement Baseline — Logins And Profile Updates Active Members Report context: who is logging in at all.